Analysis paper · Shared on request
AI project proliferation in lending and credit
What breaks in the project method when the AI candidate list goes from 5 projects to 30: dependencies and metrics.
About this paper
This is the longer analysis behind the note What breaks when the AI project list goes from 5 to 30.
The framing and assertions are my own, except where a source is cited. The appendix lists what isn't sourced, including inferences drawn from sourced facts, and gives full citations.
This paper contains no proprietary or confidential information from any previous or current employer or working relationship. I am a partner of Strategy of Things, whose reference model this paper draws on.
The argument
Firms are running machinery built for 5 technology projects against a list of 30. It breaks around return metrics and interdependencies. Per-project returns stop being measurable because every project's business case is written against a baseline the other 29 are moving, so activity reporting fills the space where return should be. And the method assumes projects are independent when they share data, models, vendors, and the same small bench. Those two combine in the enabling projects, which carry no P&L line of their own and lose every ranking that asks for one.
Starting position
A mid-market lender used to run perhaps 5 technology projects a year. The AI candidate list now runs 20 to 40. That count is anecdotal. What happens to those lists is measured.
| Source | Finding |
|---|---|
| Cambridge CCAF, 628 respondents, 151 jurisdictions, April 2026 | More than 80% have adopted AI at some level; 52% are piloting agentic AI or further along; 76% of large institutions find it hard to measure the value of AI deployment |
| Gartner, Chief Data and Analytics Officer survey, February 2025 | 30% name the inability to measure impact on business outcomes as their top challenge; 22% have defined, tracked, and communicated business impact metrics for most use cases |
| MIT NANDA, cross-industry, July 2025 | 95% of generative AI deployments show no measurable P&L impact |
| nCino, 150 US bankers, spring 2026 | 84% report enterprise-level AI use; 21% tie it to revenue |
| Wolf & Company, 17 community banks, 2026 | All use AI; 40% in pilots; 5% run scaled, governed programs |
nCino sells AI to banks. The Wolf sample is small. Gartner and MIT are cross-industry.
Dependencies
The method assumes projects are independent. In many portfolios they aren't.
They share data, models, critical vendors, and the same small bench of people who understand both the credit process and the systems.
Inside a firm the effect is direct. One project builds the document pipeline four others need. The entity resolution work with no natural owner decides whether portfolio monitoring functions at all. You can rank 30 projects in the order you'd like, and without a dependency map it's hard to know when any of them can actually be delivered.
Vendors matter more as shared platforms carry multiple projects, and that concentration is now measured. 69% of surveyed institutions use OpenAI's foundation model (CCAF, 423 of 615 respondents), a level of single-provider dependence the Financial Stability Board has flagged. Supervisors largely aren't tracking it. Only a fraction of regulators collect data on third-party AI dependencies among the firms they supervise, and nearly half have no plans to start within 2 years.
Metrics
Measuring the return on each AI project breaks somewhere between 5 projects and 30.
With 5 you can hold a baseline and measure against it. You know what servicing cost per loan was before, you know what changed, and only one thing changed. With 30 running against the same operations, every project's business case is written against a baseline the other 29 are moving.
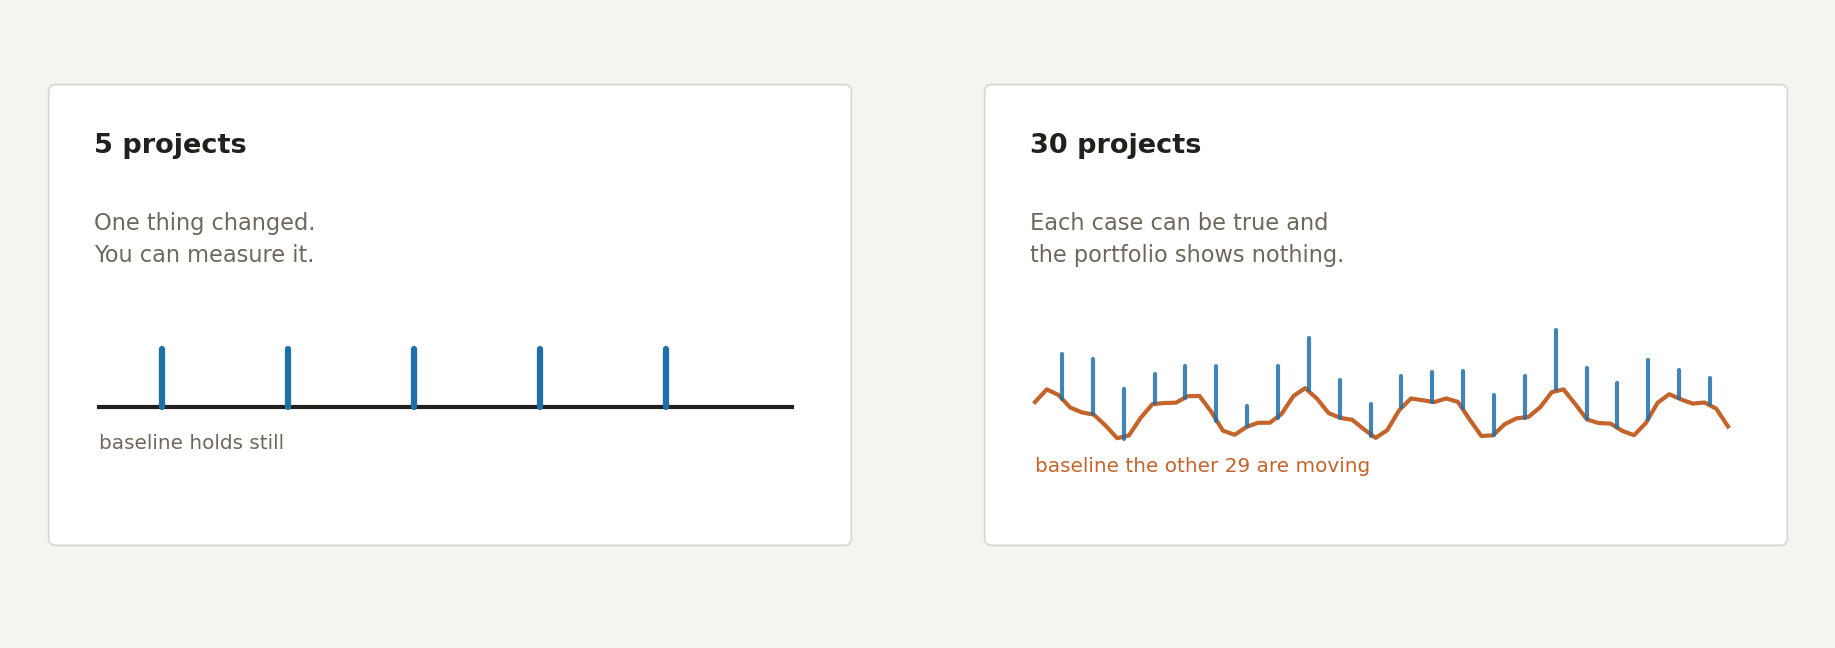
Holding a baseline still at 5 projects, and at 30.
Firms consistently confirm this. 76% of large financial institutions say they find it hard to measure the value of AI deployment (CCAF, April 2026). Across industries, 30% of chief data and analytics officers name the inability to measure impact on business outcomes as their top challenge, and only 22% have defined, tracked, and communicated business impact metrics for most of their use cases (Gartner, February 2025).
Activity reporting fills the gap. Seats licensed, documents processed, pilots launched. Those numbers are real, they're easy to produce, and a steering committee will accept them for about 18 months. But reassuring noise isn't results.
Focus on results is healthy. A too-narrow focus on P&L can distort the picture. This is because the enabling projects that earning projects depend on have no P&L line of their own. For example, the document pipeline, the data layer, the model registry, the entity resolution: none of them show up as revenue or cost saved. Earning projects are built on top and look excellent, because their business case quietly assumes the enabling work already exists.
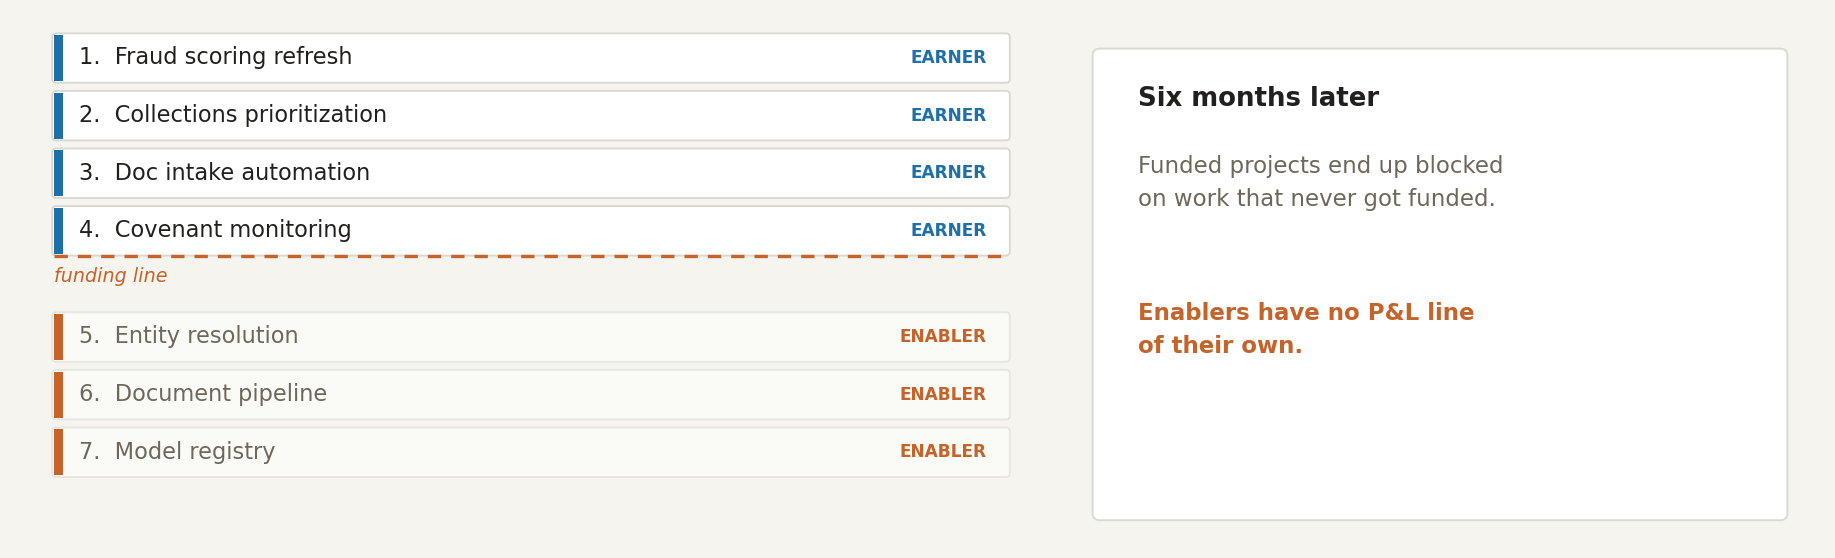
A ranking by business case, and where the enabling work falls in it.
Rank 30 projects by business case and the enablers tend to finish last. Fund only the winners, and 6 months later several of them are likely blocked by work that never got funded.
The same portfolio, sequenced on dependencies with enablers exempted from carrying their own return, produces different results from the same spend.
What changes
Return on the portfolio, execution on the project. Three or four business outcomes for the whole program (cost per funded loan, cycle time, loss rate, analyst hours on exceptions), held steady, give you something to measure against. Per-project ROI across 30 projects is hard to defend.
Dependencies before ranking. Data, models, vendors, people. The map usually reorders the list more than the value scores do.
Enablers apart from earners. Funded as infrastructure against the portfolio outcome, they avoid a justification they can't produce.
Sourcing the method
The three changes above describe a capability, and a capability carries the same build, buy, or partner question as anything else on the list.
Strategy of Things maps that surface in its 9-Layer Enterprise AI Reference Model, which runs from infrastructure and compute at L1 to strategy and leadership at L9, and groups the layers into three zones: Foundation at L1 to L3, Build at L4 to L6, and Human at L7 to L9, covering governance, adoption, and strategy (Strategy of Things, March 2026). Lower layers enable the ones above them, which gives the enabler and earner split a published structure.
Everything in this paper is Human Zone work. Holding a baseline steady, keeping a dependency map current, and funding enablers against a portfolio outcome are L7 and L9 activities. The spend, meanwhile, goes to Foundation and Build, where the projects are.
A mid-market lender rarely has an L9 capability to spare. Building one means a full-time executive and a standing portfolio function, which is hard to justify at $3bn in assets. That leaves buy or partner, which is why SoT's own answer is a fractional Chief AI Officer rather than a tool.
So the paper's own logic produces one more sourcing decision, and it is the one firms are least likely to make deliberately. Running 30 projects is a capability. It occupies the top of the stack, and few firms will build it.
Open questions
- How many of your current AI candidates depend on work that isn't on the list?
- Can you name the portfolio outcome, or only the project ones?
- Which enabler has been proposed twice and lost twice?
- Who would notice first if a shared vendor dependency failed?
- Running the list is itself a capability. Was the way you run it a decision, or a default?
I work on these questions with lenders and credit firms. The advisory page describes how.
Appendix
Sources
| Claim | Source |
|---|---|
| 76% of large institutions find it hard to measure AI value; >80% adopting AI; 52% piloting agentic AI or beyond; 69% (423 of 615) use OpenAI's foundation model; regulators largely not collecting third-party AI dependency data | Cambridge CCAF, "The 2026 Global AI in Financial Services Report: Adoption, impact and risks," April 2026. 628 respondents including 130 regulators, across 151 jurisdictions. In collaboration with BIS, IMF, WEF, World Bank, IDB, CGAP and AMF. |
| 30% of CDAOs cite inability to measure impact as top challenge; 22% have defined, tracked, and communicated business impact metrics | Gartner, press release, 20 February 2025, on its Chief Data and Analytics Officer survey. Cross-industry. |
| 95% of generative AI deployments show no measurable P&L impact | MIT Project NANDA, "The GenAI Divide: State of AI in Business 2025," July 2025. 300+ public initiatives, 52 interviews, 153 survey responses; via Virtualization Review, 19 August 2025. All industries, not lending-specific. |
| 84% of US bankers report enterprise-level AI use; 21% tie it to revenue | nCino, "AI in Banking Report," spring 2026. 150 US banking decision-makers. Vendor-commissioned; nCino sells AI to banks. |
| All community banks surveyed use AI; 5% scaled and governed; 40% in pilots | Wolf & Company, "Survey Results: 2026 AI Adoption & Maturity in Banking," 1 May 2026. 20 respondents at 17 community banks of $750M to $25B, fielded 31 January to 28 February 2026. Small sample, directional only. |
| 9-Layer Enterprise AI Reference Model: layer names, the L1 to L9 ordering, and the Foundation, Build, and Human zones | Strategy of Things, "The Secret to AI Success Isn't the Right Tools. It's the Right Model," Benson Chan, 23 March 2026. The model is the firm's own, published on its site. |
| Fractional Chief AI Officer positioning for mid-market organizations | Strategy of Things, AI offerings page, 2026. Vendor's own service description. |
| Single-provider foundation model concentration as a financial stability concern | Financial Stability Board report on the financial stability implications of AI, cited in the CCAF 2026 report. |
Not sourced
Judgment and framing:
- That a mid-market lender's list has grown from roughly 5 technology projects a year to 20 to 40 AI candidates.
- That project count is what makes per-project returns unmeasurable.
- That enabling and earning projects split the way described, and that this explains the no-measurable-return findings.
- That ranking and follow-through often have no clear owner in mid-market firms.
- Internal (within-firm) project interdependence. Vendor-concentration figures are sourced; the within-firm dependency claim is practitioner view.
- That the changes this paper describes are Human Zone work, and that mid-market lenders will more often source that capability than build it. Inference from the published model and practitioner view on mid-market staffing.
- That published AI stacks commonly stop at the technical layers, so carrying adoption and leadership inside the stack is unusual. Inference from a scan of published vendor and consultancy stack models, which run 3 to 6 layers with no canonical version.
Exists, but not used or not found:
- A survey measuring how many AI initiatives at one firm share a data dependency. I'm not aware of one, and it would settle the within-firm claim above.
- Per-firm AI project counts for US mid-market lenders specifically. Not published. The CCAF and Gartner data are cross-industry or all-of-financial-services.
Questions or a different read? Email me.